XEQT Holds 9,000 Stocks. So What Exactly Are You Buying When You Buy One Share?
July 27, 2026

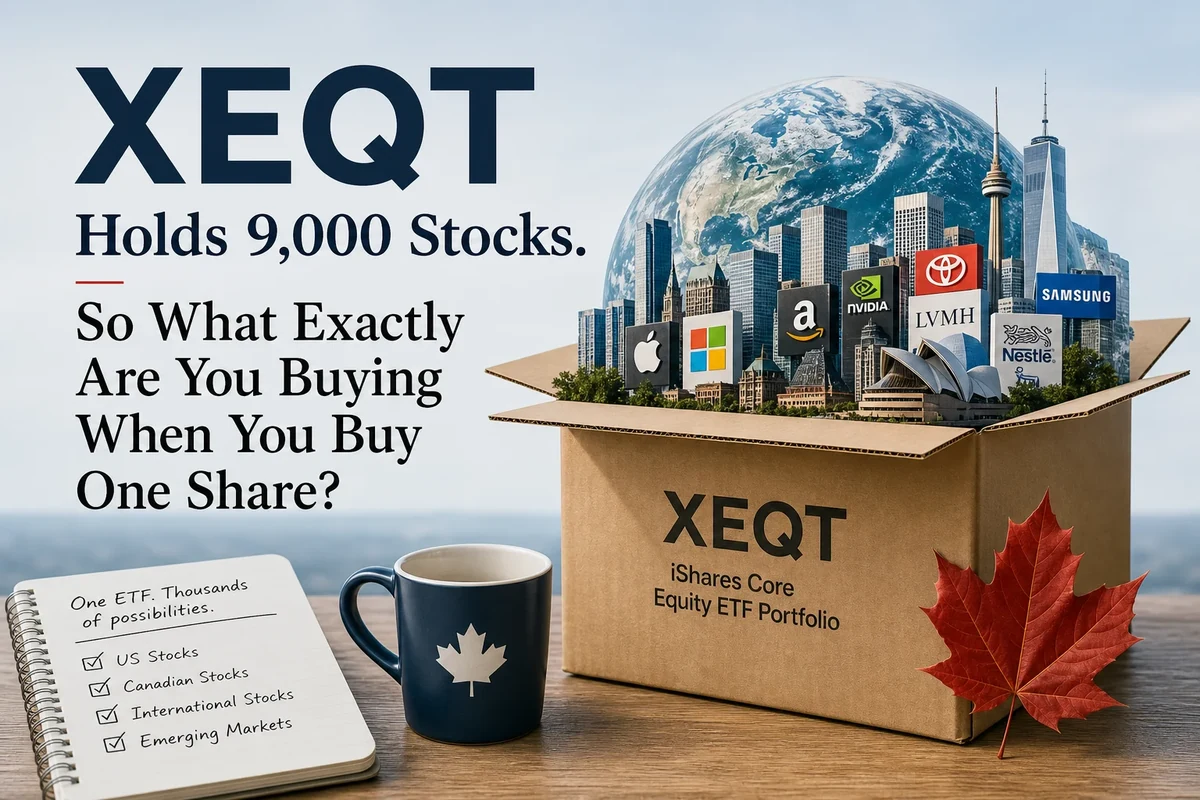
When someone tells you that XEQT holds around 9,000 stocks, the number sounds impressive. It is supposed to sound impressive. But it tells you almost nothing useful about what you actually own when you buy a single share. The raw headcount is a marketing-adjacent statistic: technically accurate, practically misleading. Understanding what you really own when you buy XEQT means looking past that number and into the four underlying funds, the geographic weights, and the sector tilts that actually drive your returns. Once you see it clearly, the picture is both more concentrated and more intelligently structured than the 9,000-stock headline suggests.
The 9,000-Stock Number Is Real, But Not What You Think
The advertised stock count for XEQT is approximately 9,000, though the figure varies depending on when you look and which source you use. Various reviews over the years have cited numbers ranging from around 8,400 to over 9,400. That variance is your first clue that the headline count is doing some rounding.
The more important caveat is what gets included in the count. When you add up the holdings across XEQT’s underlying ETFs, you inevitably count some companies more than once. A company listed on both a US exchange and a foreign exchange can appear in two separate underlying funds. Small cash positions and derivatives used for operational purposes also show up in raw holdings counts. According to analysis by the Canadian Portfolio Manager Blog, after consolidating duplicate listings and removing non-equity entries, XEQT holds approximately 8,741 unique stocks, not the round-number figure on the fund’s marketing page. That is still a massive number, but it is a real number rather than a counting artifact.
VEQT, its Vanguard counterpart, advertises over 13,000 holdings. The Canadian Portfolio Manager Blog found that VEQT’s emerging markets component alone appeared to hold over 1,100 more stocks than the index it tracks, suggesting a counting methodology that inflates the headline figure. Raw stock counts across the industry are not consistently calculated or independently audited.
The number of stocks in a fund tells you how many companies are on the list. It does not tell you how many of them actually matter to your returns. Those are two very different questions.
Four ETFs, Not 9,000 Individual Bets
XEQT is a fund of funds. BlackRock’s iShares team built it by assembling four existing ETFs into a single wrapper, then setting target weights for each. When you buy one unit of XEQT on the Toronto Stock Exchange, you are not purchasing a direct stake in thousands of companies. You are buying into a bundle that holds four bundles.
The four underlying components are ITOT (iShares Core S&P Total US Stock Market ETF), which targets approximately 47% of the fund, XIC (iShares S&P/TSX Capped Composite Index ETF), which covers Canadian equities at roughly 23%; XEF (iShares MSCI EAFE IMI Index ETF), which provides exposure to developed markets outside North America at approximately 25%; and XEC (iShares MSCI Emerging Markets IMI Index ETF), which covers emerging markets at approximately 8%.
Worth noting: iShares introduced XTOT, a newer Canadian-listed wrapper around ITOT that launched in 2025. XTOT holds ITOT inside it, so the economic exposure is identical. XEQT has begun transitioning to use XTOT for structural reasons, but the underlying US equity positions remain the same for practical purposes.
XEQT’s four building blocks: ITOT (~47% US equities), XIC (~23% Canadian equities), XEF (~25% international developed markets), XEC (~8% emerging markets). Total MER: 0.20%.
This structure has a meaningful implication: you have no individual stock selection embedded in your decision. You are not betting on Apple or Shopify or Toyota. You are buying a rules-based, market-cap-weighted slice of the global equity market as structured by BlackRock’s methodology. That sounds passive because it is. That is the point. For a full overview of how XEQT is designed and who it is built for, see our complete XEQT guide.
Why Nearly Half Your Money Ends Up in US Mega-Caps
The roughly 47% weight in ITOT is not arbitrary. It reflects the fact that the United States represents close to half of the total capitalization of all publicly traded global equity markets. Cap-weighted indexing says: own the world in proportion to its size. By that measure, the US is enormous.
Cap-weighting also means that within ITOT, your largest positions are the largest companies. Apple, Microsoft, and Amazon together represent a meaningful slice of XEQT’s total value. According to data from All Equity ETFs Review, XEQT’s top holdings have historically included Apple at approximately 2.53%, Microsoft at around 2.28%, and Amazon in the range of 1.5%. Royal Bank of Canada, representing the Canadian sleeve, has appeared at roughly 1.50%.
This concentration is a structural feature of cap-weighted indexing everywhere in the world, not a flaw in XEQT’s design. The US mega-cap influence is real and present. When US technology giants have strong years, XEQT benefits. When they correct sharply, as happened in 2022, XEQT feels it. XEQT holds the entire US market through ITOT rather than just the S&P 500, which provides some dilution from smaller-cap US stocks, but the largest companies still dominate the weight.
If you want less US mega-cap exposure, you would need to build a portfolio that intentionally deviates from market-cap weighting. That is a legitimate choice, but it is an active choice, with all the research and maintenance overhead that implies.
The Geographic Split That Actually Drives Your Returns
According to data from All Equity ETFs Review, XEQT’s top ten country allocations break down as follows: United States at 46.23%, Canada at 22.94%, Japan at 6.4%, United Kingdom at 3.04%, Switzerland at 2.51%, China at 2.31%, France at 2.18%, Germany at 2.09%, Australia at 1.8%, and Netherlands at 1.22%. Emerging markets as a category account for roughly 8% of the total fund.
A few things worth registering in this breakdown. Canada at roughly 23% is intentionally overweighted relative to its approximately 3% share of global market capitalization. BlackRock built in a home country bias that gives Canadian investors meaningful domestic exposure. This is a deliberate structural decision: it reduces currency drag on a portion of your holdings, provides exposure to Canadian dividend-paying companies like Royal Bank and Enbridge, and reflects the real-world spending patterns of Canadian investors who will ultimately need Canadian dollars.
Japan at 6.4% is the third-largest country allocation and worth registering consciously. If you have never thought about your exposure to Japanese equities, you have it, and it is material. China at 2.31% reflects its emerging market status within the XEC sleeve, which is why the number is lower than you might expect given the size of China’s economy.
Geography matters more than stock count for understanding your actual risk. A fund holding 9,000 stocks spread across dozens of countries is fundamentally different from one holding 9,000 stocks concentrated in two.
XEQT spreads across dozens of countries at meaningful weights, which provides genuine currency diversification. Your returns are partially denominated in US dollars, yen, euros, British pounds, and more. When the Canadian dollar weakens during periods of commodity or economic stress, a globally diversified portfolio in unhedged foreign equities tends to hold up relatively well in CAD terms. For a deeper look at why XEQT deliberately avoids currency hedging, see our article on why XEQT doesn’t hedge currency.
Your Sector Exposure Is More Concentrated Than You Realize
The sector breakdown of XEQT is where many new investors have a moment of surprise. According to data from All Equity ETFs Review, the fund’s sector allocations look like this: Financial Services at 16.92%, Technology at 16.84%, Industrials at 11.26%, Healthcare at 10.63%, Consumer Cyclical at 9.96%, Communication Services at 8.26%, Consumer Defensive at 7.5%, Basic Materials at 6.89%, Energy at 4.58%, Real Estate at 3.61%, and Utilities at 3.56%.
The top two sectors, Financial Services and Technology, represent roughly one-third of the entire fund between them. If you think of XEQT as some kind of perfectly balanced exposure to all human economic activity, the sector breakdown corrects that mental model. You are heavily weighted toward companies that manage money and companies that build software and hardware. That is not a criticism. Those are two of the largest and most profitable sectors in the global economy. But it is useful to know.
For Canadian investors specifically, the Financial Services weight deserves a second look. Canada’s domestic equity market is famously concentrated in banks and resource companies. XEQT’s XIC sleeve reinforces that financial sector tilt, because Royal Bank, TD, Scotiabank, BMO, and CIBC are among XIC’s largest components. You are getting Canadian banks from the XIC sleeve and US and global financials from the ITOT and XEF sleeves simultaneously. If you already hold individual Canadian bank stocks elsewhere in your portfolio, you may have more concentrated financial sector exposure than you intend.
Sector concentration reality check: Financial Services (16.92%) and Technology (16.84%) together make up roughly one-third of XEQT. Energy, which often dominates Canadian investor thinking, sits at just 4.58%.
Effective Stocks: The Number That Actually Measures Diversification
The Canadian Portfolio Manager Blog introduced a useful framework for cutting through the headcount confusion: the effective number of stocks. The concept comes from portfolio mathematics. To calculate it, you sum the squared weights of every security in the portfolio and take the reciprocal. A portfolio with one stock has an effective number of one. A portfolio of 100 equally weighted stocks would have an effective number of 100. A portfolio of 9,000 stocks where the top holdings carry heavy weights will have an effective number far below 9,000.
Applied to XEQT, the Canadian Portfolio Manager Blog found that its effective number of stocks is substantially lower than the raw count, with only a few hundred companies meaningfully driving portfolio performance at any given time. The other thousands contribute, but their individual weights are so small that they amount to statistical noise in the near term.
Here is the counterintuitive finding: the Canadian Portfolio Manager Blog concluded that XEQT’s effective diversification is actually higher than VEQT’s, despite VEQT advertising over 13,000 holdings. VEQT holds a higher weight in Canadian equities (roughly 30% versus XEQT’s 23%), and Canadian equities are a concentrated index dominated by a handful of large banks and resource companies. XEQT’s higher allocation to international developed markets through XEF brings in companies with less individual concentration, which raises the effective stock count. More stocks on a list does not mean more diversification. The weights determine the reality. For a full side-by-side on how these two funds compare, see our XEQT vs VEQT comparison.
Where You Hold XEQT Changes What You Keep
XEQT’s 0.20% MER is the same regardless of which account you hold it in. But the after-tax return you experience is meaningfully different depending on whether it lives in your TFSA, RRSP, FHSA, or a non-registered account.
Inside a TFSA, XEQT grows entirely tax-free. The 2026 annual contribution limit is $7,000, and cumulative room for anyone who has been eligible since 2009 is $109,000. Distributions are not taxed when received, and capital gains are not taxed when you eventually sell. The friction point is foreign withholding tax: US dividends paid within XEQT are subject to roughly 15% withholding even in a TFSA, because the Canada-US tax treaty does not extend its exemption to TFSAs. According to Canadian Portfolio Manager Blog’s foreign withholding tax calculations, this creates a drag of approximately 0.22% per year on top of the 0.20% MER.
Inside an RRSP, the Canada-US tax treaty fully exempts the account from US withholding tax. Your effective drag from the US portion of XEQT drops to zero. The total cost in an RRSP is effectively just the 0.20% MER, making it the most cost-efficient account for holding XEQT if you have room available. The 2026 RRSP contribution limit is 18% of your prior year earned income, up to a maximum of $32,490.
An FHSA, for those using one to save for a first home, behaves like a TFSA for withholding purposes: the 15% withholding on US dividends still applies. The annual limit is $8,000 and the lifetime maximum is $40,000. XEQT is an eligible holding in an FHSA.
In a non-registered account, the 15% treaty withholding rate applies on US dividends, though you may be able to recover some of it through a foreign tax credit. Distributions are reported on a T3 slip, not a T5, which surprises many first-time investors. XEQT is structured as a trust, not a corporation, so T3 is the correct slip. Capital gains on eventual sale are also taxable in non-registered accounts.
The fund is identical regardless of where you hold it. The account determines what you keep after tax. Getting the account order right is worth more attention than most investors give it.
You Never Touch the Weights: That Is the Whole Point
Once you understand that XEQT is built from four underlying ETFs with specific target allocations, a natural question follows: who maintains those allocations over time? BlackRock’s portfolio management team does, operating continuously and invisibly to you.
When US equities have a strong run and the ITOT sleeve drifts well above its target weight, BlackRock sells some ITOT and buys more of the underweighted sleeves. When Canadian equities lag, the XIC weight drifts down and gets corrected. This happens at the fund level. You see none of it as a transaction in your brokerage account. There are no tax consequences triggered for you personally when this occurs inside a registered account, and even in a non-registered account the gains and losses from internal rebalancing are pooled across the fund rather than creating individual taxable events for each unitholder.
What this means practically: your only job is to buy more XEQT when you have money to invest. On Wealthsimple or Questrade, both of which offer commission-free ETF purchases, this is a matter of placing a market or limit order. You contribute to your TFSA or RRSP, you buy XEQT, and you leave it alone. BlackRock handles the rest. The 0.20% MER covers all of that ongoing management and does not change based on how much you invest.
This design eliminates one of the most quietly damaging behaviours in DIY investing: the urge to “fix” a portfolio after a market move. When US equities have a rough quarter, investors holding the individual components separately often second-guess their US weighting. XEQT investors have nothing to adjust. The fund corrects itself, and the investor’s only meaningful variable is whether they keep buying.
Frequently Asked Questions
Does XEQT hold individual stocks directly? No. XEQT holds four underlying ETFs: ITOT for US equities, XIC for Canadian equities, XEF for international developed markets, and XEC for emerging markets. Your exposure to individual companies like Apple or Royal Bank flows through these funds, not through direct stock ownership. XEQT itself holds four positions at the fund level, the thousands of underlying stocks live inside those four funds.
If XEQT holds 9,000 stocks, why is it so concentrated in the US? Most of XEQT’s stock count comes from the international and emerging markets sleeves, which hold hundreds of smaller companies with tiny individual weights. The US allocation of approximately 46% is held through ITOT, which is cap-weighted, so the largest US companies command the largest shares of that sleeve. The headline stock count and the actual dollar distribution of your investment are two very different things.
Is XEQT more diversified than VEQT despite holding fewer stocks? According to analysis by the Canadian Portfolio Manager Blog, yes, when measured by the effective number of stocks. XEQT’s effective diversification comes out ahead of VEQT’s because XEQT holds a higher weight in international equities, which are less concentrated at the individual company level, and a lower weight in Canadian equities, which are heavily skewed toward a handful of large banks and resource companies. VEQT’s larger raw stock count is partly an artifact of how its holdings are calculated.
Does it matter which account I hold XEQT in? Yes, significantly. An RRSP is the most tax-efficient home for XEQT because the Canada-US tax treaty eliminates US withholding tax entirely inside that account. A TFSA is excellent for tax-free growth, but the 15% withholding on US dividends still applies. Non-registered accounts are the least efficient option, with foreign withholding, income tax on distributions, and capital gains tax on eventual sale all in play. For most Canadians, filling TFSA and RRSP room before investing in a non-registered account is the right order of operations.