
XEQT Holds 9,000+ Stocks. Here’s Why That Number Should Calm You Down
September 28, 2026

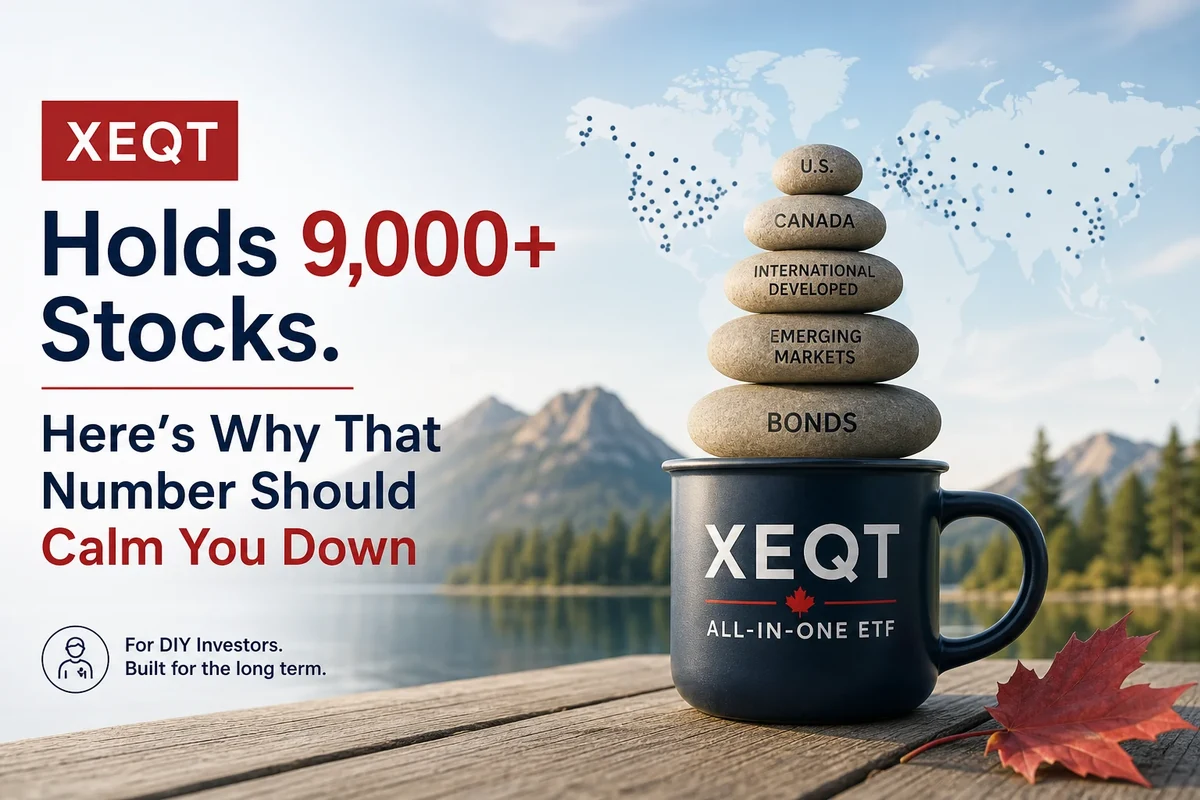
XEQT holds 9,444 stocks. That number gets quoted a lot, mostly to reassure nervous investors. But the reassurance is usually skin-deep: “lots of stocks means you’re diversified” is technically true but misses most of what actually matters. The real question is not how many names are in the fund. It is how the exposure is distributed across those names, and whether any single company, country, or sector can meaningfully derail your outcome. As of mid-2026, XEQT’s largest single holding is Apple at roughly 2.53% of the fund, its top ten positions combined represent about 11% of the total, and it spans 11 distinct sectors and more than 40 countries. That is not just diversification as a marketing word. That is the structural reality, and it is worth understanding exactly why it should change how you feel about owning one ETF.
Why Your Brain Lies to You About Stock Count
The human mind is reasonably good at detecting danger but genuinely poor at assessing statistical diversification. When someone hears “9,000 stocks,” the brain registers something like: plenty of options, probably safe. When that same person hears a friend lost money on a single stock, they feel the pain acutely. The gap between those two responses drives a lot of bad investing behaviour in Canada.
Portfolio anxiety is one of the top reasons Canadians over-complicate their investment approach. A saver starts with XEQT, reads a few investing forums, discovers that XIC, XEF, XUU, and XEC are the underlying components, and starts wondering whether they should just buy those directly. Or they notice that a colleague is building a “more sophisticated” portfolio with twelve ETFs and start wondering what they are missing. The anxiety compounds until the simple solution feels embarrassingly naive.
It is not naive. But understanding why it is not naive requires getting specific about what diversification actually does, which is something most Canadians never hear explained clearly.
Diversification does not mean owning more things. It means ensuring no single thing controls your outcome. Those two definitions lead to very different portfolios.
The Metric That Actually Matters: Effective Number of Stocks
Raw stock count is a misleading measure of diversification because it ignores concentration. Consider two simple portfolios. Portfolio A holds ten stocks, each at 10% of the fund. Portfolio B holds eleven stocks, but one stock takes up 90% and the other ten split the remaining 10% equally. Portfolio B technically holds more companies. In practice, Portfolio B is almost entirely a single-stock bet. Most investors would correctly identify Portfolio A as more diversified, but raw count would tell the opposite story.
The metric that corrects for this is called the effective number of stocks. The calculation takes the sum of the squared weights of every holding in the portfolio and then takes the reciprocal of that result. A portfolio of ten equally weighted stocks has an effective number equal to ten. A portfolio where one stock holds 90% and nine others split the rest has an effective number near one, regardless of how many names appear on the holdings list. The metric ranges from one (single-stock exposure) up to the total number of holdings, which would only be achieved by a perfectly equally weighted portfolio.
According to analysis by the Canadian Portfolio Manager blog, which performed this calculation across XEQT and VEQT’s full holdings using the sum-of-squared-weights methodology, XEQT has an effective number of stocks of approximately 198, compared to VEQT’s approximately 180. This despite the fact that VEQT holds over 13,000 individual stocks, roughly 3,600 more than XEQT. The reason XEQT scores higher on effective diversification is its heavier allocation to international developed markets, which are themselves more evenly distributed across many mid-sized economies, versus VEQT’s larger Canadian tilt, which concentrates more weight in Canadian banks and energy names that dominate the TSX. More holdings on paper, less effective diversification in practice.
Effective diversification comparison: XEQT holds ~9,444 stocks with an effective number of approximately 198. VEQT holds 13,000+ stocks but achieves an effective number of only ~180. More holdings, less real diversification. (Source: Canadian Portfolio Manager Blog, sum-of-squared-weights methodology)
Where XEQT’s 9,444 Stocks Actually Live
XEQT is a fund of four underlying iShares ETFs: XUU (US equities), XIC (Canadian equities), XEF (international developed markets), and XEC (emerging markets). Together, these four funds span more than 40 countries and every major equity market on earth. The geographic breakdown, sourced from Canadian Portfolio Manager research and Morningstar, is presented below as of 2025 data.
| Country | Allocation |
|---|---|
| United States | 46.23% |
| Canada | 22.94% |
| Japan | 6.40% |
| United Kingdom | 3.04% |
| Switzerland | 2.51% |
| China | 2.31% |
| France | 2.18% |
| Germany | 2.09% |
| Australia | 1.80% |
| Netherlands | 1.22% |
| Other (30+ countries) | ~9.28% |
What this means practically: a single bad year for Canadian banks, which represent the largest sector concentration on the TSX, does not meaningfully move XEQT’s outcome. A recession in Germany barely registers. Even a significant correction in US large-cap technology, which receives more attention than almost any other risk factor among Canadian retail investors, affects only a portion of XEQT’s total exposure. The fund’s broad international weighting acts as a genuine shock absorber, not a marketing feature.
Canada itself represents roughly 3% of global market capitalization. Holding 23% in Canadian stocks is already a deliberate home-country tilt above the global market-cap weight, designed to reduce currency mismatch for investors who spend in Canadian dollars. Going much further than that starts looking less like prudence and more like a concentrated bet on the TSX.
Why XEQT Beats VEQT on Diversification Despite Holding Fewer Stocks
This counterintuitive result deserves a direct explanation. VEQT, Vanguard’s all-equity equivalent, allocates approximately 30% to Canadian equities, compared to XEQT’s roughly 23%. That extra Canadian weighting comes heavily from the TSX Composite, which is itself concentrated in financial services, energy, and materials. Canadian banks like Royal Bank and TD individually make up large slices of any Canada-heavy fund. That concentration shows up in the effective number of stocks calculation: each time a fund gives an outsized weight to a few large-cap names, the effective number decreases.
XEQT’s higher weighting to international developed markets means more of the fund’s weight falls on mid-sized European and Japanese companies that are individually small relative to US mega-caps. That broader, flatter distribution pushes the effective number of stocks higher. The Canadian Portfolio Manager blog’s conclusion is clear: VEQT holds more stocks, but XEQT delivers more effective diversification. If you want to explore the full comparison in depth, the dedicated XEQT vs. VFV breakdown shows how concentration plays out across different fund structures.
VEQT’s MER is 0.24% (as of mid-2026), compared to XEQT’s 0.20%. Over a $300,000 portfolio, that 0.04% difference translates to $120 per year in additional fees, every year, for a product that is measurably less diversified on an effective-stock basis. The math does not favour complexity here.
Eleven Sectors, No Picking Required
When Canadians build their own stock portfolios, they tend to cluster in what they know: the banks they use, the telecoms that send them bills, the energy companies they read about in the news. Research on individual investor behaviour consistently shows that self-directed investors hold portfolios concentrated by familiarity rather than analytical judgment, and that this concentration reduces risk-adjusted returns over time. XEQT sidesteps this entirely.
According to Morningstar data compiled in the Canadian Portfolio Manager research, XEQT’s sector breakdown spans all eleven GICS sectors automatically (as of 2025 data): Financial Services at 16.9%, Technology at 16.8%, Industrials at 11.3%, Healthcare at 10.6%, Consumer Cyclical at 10.0%, Communication Services at 8.3%, Consumer Defensive at 7.5%, Basic Materials at 6.9%, Energy at 4.6%, Real Estate at 3.6%, and Utilities at 3.6%. No single sector holds more than 17% of the fund.
This breadth matters because different sectors lead at different points in the economic cycle. Healthcare and consumer defensives tend to hold up in downturns. Technology and consumer cyclicals lead in growth periods. Energy and materials respond to commodity prices. By holding all of them, XEQT captures whatever rotation is happening without requiring you to predict it in advance, which is something individual investors cannot do reliably or consistently.
The Concentration Risk You Actually Need to Worry About (It Is Not in XEQT)
One of the legitimate concerns about passive investing in 2024 and into 2026 has been that global index funds were becoming too concentrated in US mega-caps. This concern has real merit as applied to S&P 500 funds or US-only ETFs. It is substantially less relevant when applied to XEQT.
XEQT’s top ten holdings, as tracked by the Canadian Portfolio Manager blog and Morningstar data, are Apple at 2.53%, Microsoft at approximately 2.23%, Amazon at roughly 1.87%, and Royal Bank at approximately 1.41%, with the remaining top-ten names each below 1.5% and tapering from there. The entire top-ten block represents approximately 11% of the fund. That is not a Magnificent Seven fund. That is not a bank fund. It is a genuinely distributed portfolio where thousands of positions each contribute a fraction of a percent to the overall outcome.
When no single company represents more than 2.53% of your portfolio, you cannot be catastrophically wrong about any one of them. That is not luck. That is structure.
Compare this to a self-directed investor who has put 20% of their TFSA into a single bank stock, 15% into one tech name, and the rest spread across five or six positions they feel good about. That investor is exposed to specific management decisions, sector headwinds, and single-company risk at a scale XEQT does not come close to. And they are doing the work themselves, paying no one to rebalance, and are unlikely to outperform after fees and taxes over a decade. The rebalancing explainer walks through exactly how BlackRock handles drift internally, without the investor lifting a finger.
XEQT top-10 concentration: Apple 2.53%, Microsoft ~2.23%, Amazon ~1.87%, Royal Bank ~1.41%. All ten combined: roughly 11% of the fund. No single position can materially derail the portfolio’s long-term outcome. (Source: Canadian Portfolio Manager Blog / Morningstar, 2025 data)
One Fund vs. Four: The DIY Temptation and Its Hidden Costs
The natural next question for an investor who has read this far: if XEQT is just XUU, XIC, XEF, and XEC wrapped together, why not buy those components separately and save the fund-wrapper fee? The logic is appealing in theory. In practice, it runs into several problems that the fee savings rarely overcome.
The MER on the underlying components is indeed lower in aggregate than XEQT’s 0.20% blended rate, by roughly 9 to 10 basis points. On a $50,000 portfolio, that is approximately $45 to $50 per year in savings. Against that saving, you take on several costs. Trading commissions reduce the advantage unless you use a commission-free broker. Rebalancing yourself requires calculating the drift across four positions, making deliberate decisions about what to buy or sell, executing the trades, and tracking adjusted cost base carefully in any non-registered account. More importantly, as the Canadian Portfolio Manager blog has noted, the international developed market allocation within funds like VEQT drifts over time as index methodology changes, making exact replication difficult without accepting ongoing tracking error.
The practical reality is that most DIY component investors eventually either drift away from their target weights, sell during drawdowns, or discover the tax friction in non-registered accounts is more significant than they anticipated. XEQT’s 0.20% MER is not just the cost of a portfolio solution. It is the cost of permanent, automatic, tax-efficient rebalancing across 9,444 positions in 40-plus countries. For a fuller breakdown of what you are actually paying and what you get in return, the MER explainer covers the math in detail.
What 9,000 Stocks Means for Your Registered Accounts
There is a tax argument for XEQT’s structure that rarely gets mentioned alongside the diversification case. Because XEQT holds only four underlying ETFs and rebalancing happens at the fund level rather than through individual stock trades, the portfolio’s internal turnover is low relative to what you would generate rebalancing a multi-ETF portfolio yourself. When the fund rebalances internally, you do not receive a capital gains distribution triggered by your own trading. The rebalancing activity is absorbed at the fund level and pooled across all unitholders through the fund’s adjusted cost base tracking.
XEQT is eligible to be held in a TFSA ($7,000 annual contribution room in 2026), an RRSP (up to 18% of prior-year earned income, with a maximum of approximately $32,490 for 2026), and an FHSA ($8,000 per year, $40,000 lifetime maximum). For most Canadians in the accumulation phase, filling these registered accounts with XEQT is the most tax-efficient use of the diversification it provides, keeping growth, dividends, and foreign income sheltered from CRA as long as possible. The foreign withholding tax situation carries some nuance depending on which account type you hold XEQT in, but the baseline advantage of low turnover and a single-fund structure applies across all of them.
2026 registered account limits: TFSA: $7,000/year. RRSP: 18% of prior year income (max ~$32,490). FHSA: $8,000/year, $40,000 lifetime. XEQT is eligible in all three and available commission-free through Questrade and Wealthsimple.
Frequently Asked Questions
How many stocks does XEQT actually hold?
As of 2025 data from iShares Canada and the Canadian Portfolio Manager review, XEQT holds approximately 9,444 individual stocks through four underlying iShares ETFs covering Canada, the US, international developed markets, and emerging markets. The count fluctuates slightly as underlying indices rebalance, but the order of magnitude is consistent.
Is XEQT more diversified than VEQT?
Despite holding roughly 3,600 fewer individual stocks, XEQT achieves a higher effective number of stocks (approximately 198 vs. 180 for VEQT) because its lower Canadian home-country allocation means less concentration in Canadian banks and energy companies. According to the Canadian Portfolio Manager blog’s analysis using the sum-of-squared-weights methodology, effective number of stocks is a more meaningful measure of diversification than raw holdings count.
What are XEQT’s largest holdings?
XEQT’s top holdings as of 2025 data include Apple at approximately 2.53%, Microsoft at about 2.23%, and Amazon at roughly 1.87%. Royal Bank of Canada is the largest Canadian name at around 1.41%. The top ten positions together represent only about 11% of the fund, meaning no individual company can materially derail the portfolio’s long-term outcome.
Can I replicate XEQT by buying the underlying ETFs myself?
You can buy XUU, XIC, XEF, and XEC separately, and some investors do. The potential fee saving is roughly 9 to 10 basis points per year, which amounts to approximately $45 to $50 annually on a $50,000 portfolio. Against that saving, you take on manual rebalancing, possible trading commissions, adjusted cost base tracking in non-registered accounts, and the behavioural risk of not rebalancing consistently during market drawdowns. For most investors, the XEQT wrapper is worth the modest premium.