
The Market Is Down 20%. Your Move Is Still the Same
September 30, 2026

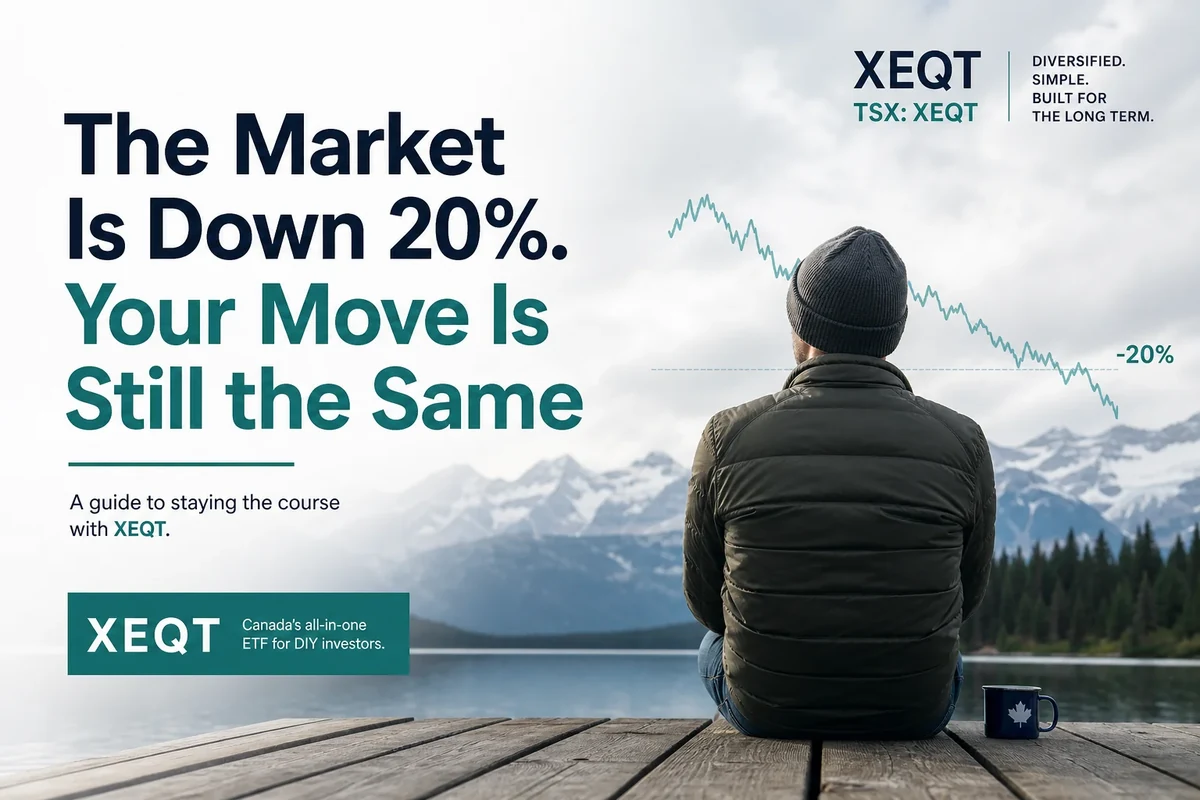
Do nothing different. If you are years away from needing the money, a 20% drop in XEQT is a sale price, not a signal. Keep your automatic contributions running, stay out of the app for a few weeks, and let the fund’s built-in rebalancing do its job. If you are retired or close to it, the answer is also not to sell, but that only works if you already hold a cash or short-term buffer outside equities. The rest of this article shows why, using real numbers.
As of September 2026, XEQT trades around $45.64, close to its 52-week high of $46.48, so this is the right moment to write your plan. Nobody decides well at minus 20% with a pit in their stomach. I checked the return figures below against iShares’ published calendar-year returns and worked the unit-count math myself, so you can rerun it with your own numbers.
Why a 20% Loss Feels Worse Than the Math Says It Should
Kahneman and Tversky’s research on loss aversion found that people feel a loss roughly twice as intensely as they enjoy an equivalent gain. Watch $100,000 become $80,000 and your brain files it as $20,000 gone, not as a temporary repricing of thousands of companies. The arithmetic is calmer than the feeling: an $80,000 balance needs a 25% gain to return to $100,000, and diversified equity markets have delivered gains like that many times.
Headlines make it worse, because bad news gets clicks. Canadians also absorb plenty of TSX coverage, but XEQT holds roughly 25% Canadian equities, 45% US, 25% international developed and 5% emerging markets. A scary TSX headline describes about a quarter of what you own.
Crashes also look worse in the moment than in hindsight. In the 2020 pandemic crash, Canadian equities fell more than 37% at the low, according to the Canadian Couch Potato’s review of 2020 portfolio returns. By year-end they had recovered to modest positive returns, and all-in-one asset allocation ETFs finished the year between roughly 8.4% and 11.4%. Anyone who sold in March 2020 turned a temporary decline into a permanent loss in a year that ended well.
A paper loss becomes a real loss only when you sell. The decision to sell is the one part of a crash you control, and it is usually the wrong one.
The Behavior Gap Is Real and It Is Expensive
The behavior gap is the difference between what a fund returns and what its average investor earns. DALBAR’s annual studies are the usual source, and the gap is often quoted at 2 to 4 percentage points a year. The methodology is debated, so treat that as a rough range. The direction is consistent: investors buy after rallies, sell after drops, and trail the funds they own.
Consider XEQT’s calendar-year returns as published by BlackRock: 19.57% in 2021, then a 10.93% loss in 2022, then gains of 17.05% in 2023, 24.67% in 2024 and 20.45% in 2025. Someone who invested $10,000 at the start of 2022 and did nothing ended 2025 with about $15,650. Someone who sold at the end of 2022 with $8,907 left, waited out 2023, and bought back in for 2024 ended with about $13,375. That is roughly $2,300 lost for one year of feeling safe. Scale it to a $200,000 portfolio and the cost is about $45,000.
Fees are the smaller leak. As of September 2026, XEQT’s MER is 0.20%. If a portfolio earns 7% before fees, $100,000 grows to about $518,000 over 25 years at that cost, versus about $339,000 at a 2% mutual fund fee. That is an illustrative calculation, not a forecast, and our breakdown of what XEQT’s 0.20% MER actually costs you goes deeper. Selling at the bottom adds a bigger leak on top.
Should You Sell XEQT When the Market Is Down 20%? Your Allocation Was Right Yesterday
No, not if your timeline is long and your income is steady. Selling after a 20% drop converts a recoverable paper loss into a permanent one, and it forces you to get the re-entry timing right, which few investors manage. Your asset allocation should be settled before a crash, and a crash is not new information about your timeline.
A widely cited analysis of the 2000 to 2002 bear market shows why the allocation decision matters. Cumulative inflation-adjusted returns were a loss of 34.35% for an 80/20 stock and bond mix, 19.99% for 60/40, 13.87% for 50/50, and a gain of 6.29% for 20/80. That is a general asset allocation reference rather than Canada-specific data, but the pattern holds everywhere: more equities, deeper hole.
Drawdown risk in a 100% equity fund. XEQT holds no bonds, so in a repeat of 2000 to 2002 it would likely have fallen further than the 80/20 mix’s 34.35%. A 20% drop is a normal bear market, not the floor. Ask yourself today whether you could watch a 40% decline and keep buying.
If the honest answer is no, adjust your allocation now, in calm markets, instead of selling mid-panic. Bonds are not guaranteed shelter either. In 2022, iShares’ XGRO fell 11.00%, XBAL fell 11.08% and XCNS fell 11.19%, against 10.93% for XEQT, because stocks and bonds dropped together.
Rebalancing is the rule-based move in a downturn, not timing. With XEQT it happens inside the fund, as covered in our explainer on whether you need to rebalance XEQT. If you pair XEQT with a separate bond fund, rebalancing means directing new money toward whichever side has drifted below target, which in a crash means buying equities.
On duration, Vanguard figures cited by Monevator put the typical UK and US bear market at about 1.1 years, while Global Financial Data’s global history, also discussed by Monevator, averages about 25 months excluding the First World War and 1987 outliers. The worst modern case was the UK’s 1972 to 1974 crash, a decline of roughly 73% in real terms that took nine years to break even after inflation. That is a UK figure, not a Canadian one, and it is an honest upper bound. Monevator also showed that annual contributions of just 3% of the starting portfolio cut that recovery to six years.
If You Still Have Employment Income, This Is Your Best Day
If you are still working, a 20% drop is a sale on the asset you were going to buy anyway. Your contributions are fixed in dollars, so a lower price buys more units automatically. Dollar-cost averaging predicts nothing. It just makes the arithmetic work for you.
Suppose XEQT falls 20% from $46.48 to about $37.18, a hypothetical rather than a forecast. A $500 biweekly contribution buys about 10.76 units at $46.48 and about 13.45 units at $37.18, which is 25% more for the same money. After 13 contributions, about six months and $6,500, you own roughly 35 more units than you would have at the higher price. If the price climbs back to $46.48, those extra units are worth about $1,626.
The 20% discount effect. A dollar buys 25% more units when a fund is 20% cheaper, because one divided by 0.80 equals 1.25. Every contribution you keep making through a drawdown works at that rate.
Inside a TFSA, RRSP or FHSA, selling at a loss earns you nothing, because there is no capital loss to claim against other gains, while growth is tax-free or tax-deferred, so the recovery is sheltered. An RRSP or FHSA contribution also earns a deduction, so you buy the discounted units with pre-tax dollars. As of 2026, the limits are $7,000 for the TFSA, $8,000 for the FHSA ($40,000 lifetime) and 18% of prior-year earned income up to $32,490 for the RRSP.
Panic-selling inside a TFSA carries a trap. Withdrawn amounts are only added back to your room on January 1 of the following year, so if you sell in October and change your mind in November, you can rebuy only with unused room, and pushing past it risks an over-contribution penalty. The same logic makes waiting for the dip a poor plan, since your contributions are already doing the buying.
The Real Risk Is Selling Because You Need the Money
Panic-selling and forced selling look identical on a statement, but they are different problems. Panic is a failure of nerve, and a plan written in advance fixes it. Forced selling is a failure of structure: you sell because the bills are due, whatever the price.
During accumulation, even a bad panic-sell is recoverable because future paycheques can rebuild the balance. In retirement, the same sale does lasting damage because no new money offsets it. This is sequence of returns risk. Early Retirement Now’s Safe Withdrawal Rate series makes the point sharply: the one investor fully insulated from it is the buy-and-hold investor who never withdraws.
Take a $1,000,000 portfolio with a planned $40,000 annual withdrawal. After a 20% crash it is worth $800,000, and the same $40,000 is now 5% of the pot instead of 4%. Selling at $37.18 instead of $46.48 means giving up about 1,076 units to raise $40,000 instead of about 861. Those extra 215 units are gone and cannot join the rebound.
Retirees more often fail because they had no other source of cash when the market fell than because they panicked.
RRSP and RRIF withdrawals add a Canadian wrinkle. They are fully taxable as income, and unlike a TFSA, the room you use up is never restored. All else equal, a forced RRSP sale in a downturn costs more than a forced TFSA sale, where room returns the following January. Our XEQT withdrawal strategy guide covers how to sequence withdrawals across accounts.
The income floor is the real defence. CPP and OAS are indexed to inflation and do not shrink when markets fall, so every dollar of fixed costs they cover is a dollar you never have to raise by selling equities. Cash, GICs or short-term bonds should cover the gap between those payments and your spending. Planners commonly suggest at least 12 to 18 months of withdrawals in that buffer, and some go to two or three years. The right number depends on how much of your spending you could cut in a bad year.
What to Do Monday Morning
Before you touch anything, confirm your allocation matches your timeline. If you need this money within five years and a 40% decline would force you to sell, you are overexposed and should shift toward a more conservative fund gradually, not in one panicked move. If your timeline is 15 years or more and your income is steady, leave XEQT alone. Our complete XEQT guide explains what the fund holds and why it is built to be left alone.
Once that is settled, automate the buying so you are not making a decision every two weeks. Set a recurring transfer and purchase in Wealthsimple or Questrade that runs on payday, then remove the account shortcut from your phone’s home screen. Contributions that happen without your input are hard for fear to cancel.
If you are retired or within a few years of it, confirm that your buffer is large enough to avoid selling any XEQT through a full bear market. Count CPP and OAS first, subtract them from your spending, and fund the remainder. If you are still sizing up whether your portfolio can support retirement, our XEQT retirement number guide is the place to start.
Frequently Asked Questions
Should I sell XEQT if the market drops 20%? Not if your timeline is long and your income is steady. XEQT fell 10.93% in 2022, then gained 17.05%, 24.67% and 20.45% in the next three years, and selling would have missed that rebound.
How long do bear markets last? Vanguard figures cited by Monevator put the typical UK and US bear at about 1.1 years, and global data averages about 25 months. Recovery to the old high can take longer, as the UK’s 1972 to 1974 crash did, taking nine years to break even after inflation.
Should I keep contributing to my TFSA or RRSP during a crash? If your income is steady, yes. Fixed-dollar contributions buy about 25% more units at a 20% discount, and the recovery is sheltered from tax inside these accounts.
How much cash should a retiree hold to avoid selling in a downturn? Planners commonly suggest 12 to 18 months of withdrawals at minimum, after subtracting CPP and OAS, and some go to two or three years. The right amount depends on how much spending you could cut in a bad year.